

Virginia Environmental Justice Indices
In 2020 the Virginia Environmental Justice Act was passed, which required state agencies to examine any new regulation or policy or amendment to an existing regulation or policy involving state action or funds in relation to its impact on environmental justice prior to adoption of the regulation or policy.While an application was provided by DEQ to use for coordination with VDOT, in 2025 environmental staff noticed that the dataset had not been updated to the latest US Census Bureau statistics. I recreated the indices using the latest American Community Survey. The indices determine the percent of low income and population of color populations across the state. Upon verifying with DEQ they confirmed I had accurately reverse-engineered their statistical methodology!
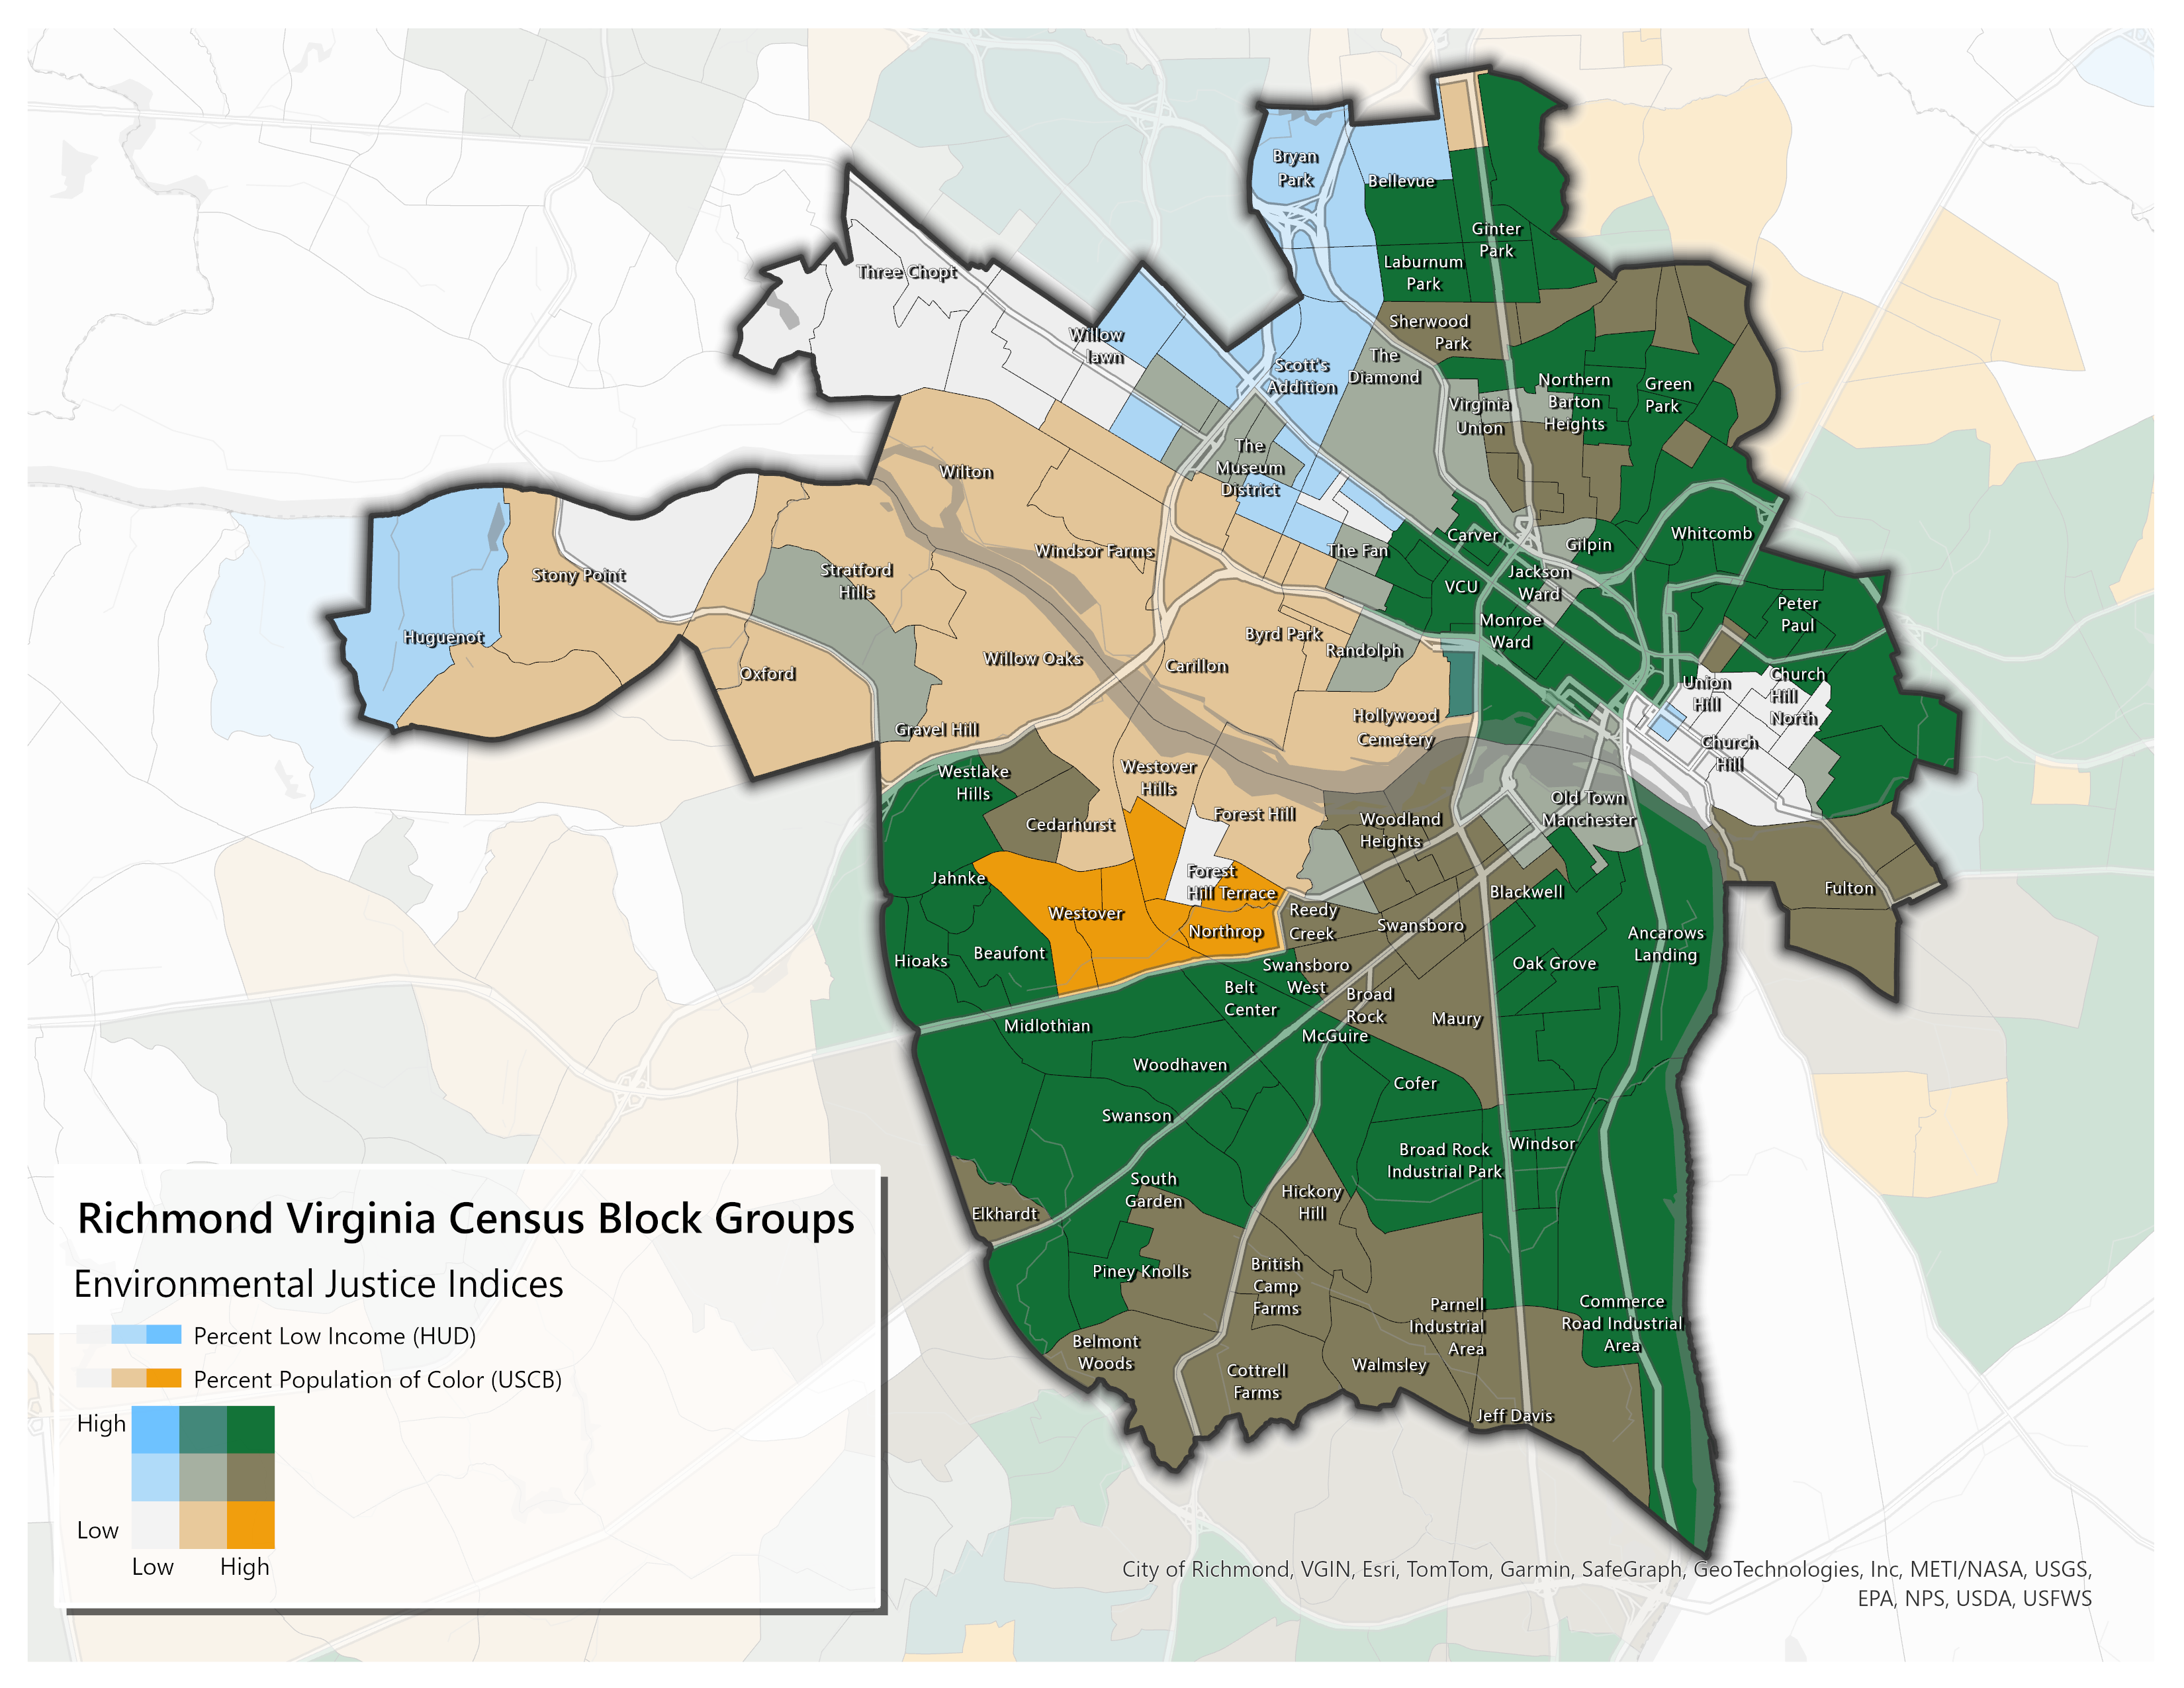
Here is the city of Richmond’s census block groups presented as a bivariate chloropleth of the two indices. The dark green areas have a high concentration of both indices, and the light gray has a low concentration.
This visualization enables quick identification of more vulnerable neighborhoods as well as areas where inequality is more stark.
*statistics, excel, and arcgis pro used to create this map
Dashboards and Reporting
I make lots of different analytical reports and tools to enable decision making and guide transportation planning. I lead an internal effort for the creation of an enterprise report server that connected to the VDOT environmental database. Now reports are automatically refreshed daily and are built using a model of the underlying relational data.
Power BI Project Examples
Ex 1) NEPA Completions Widget
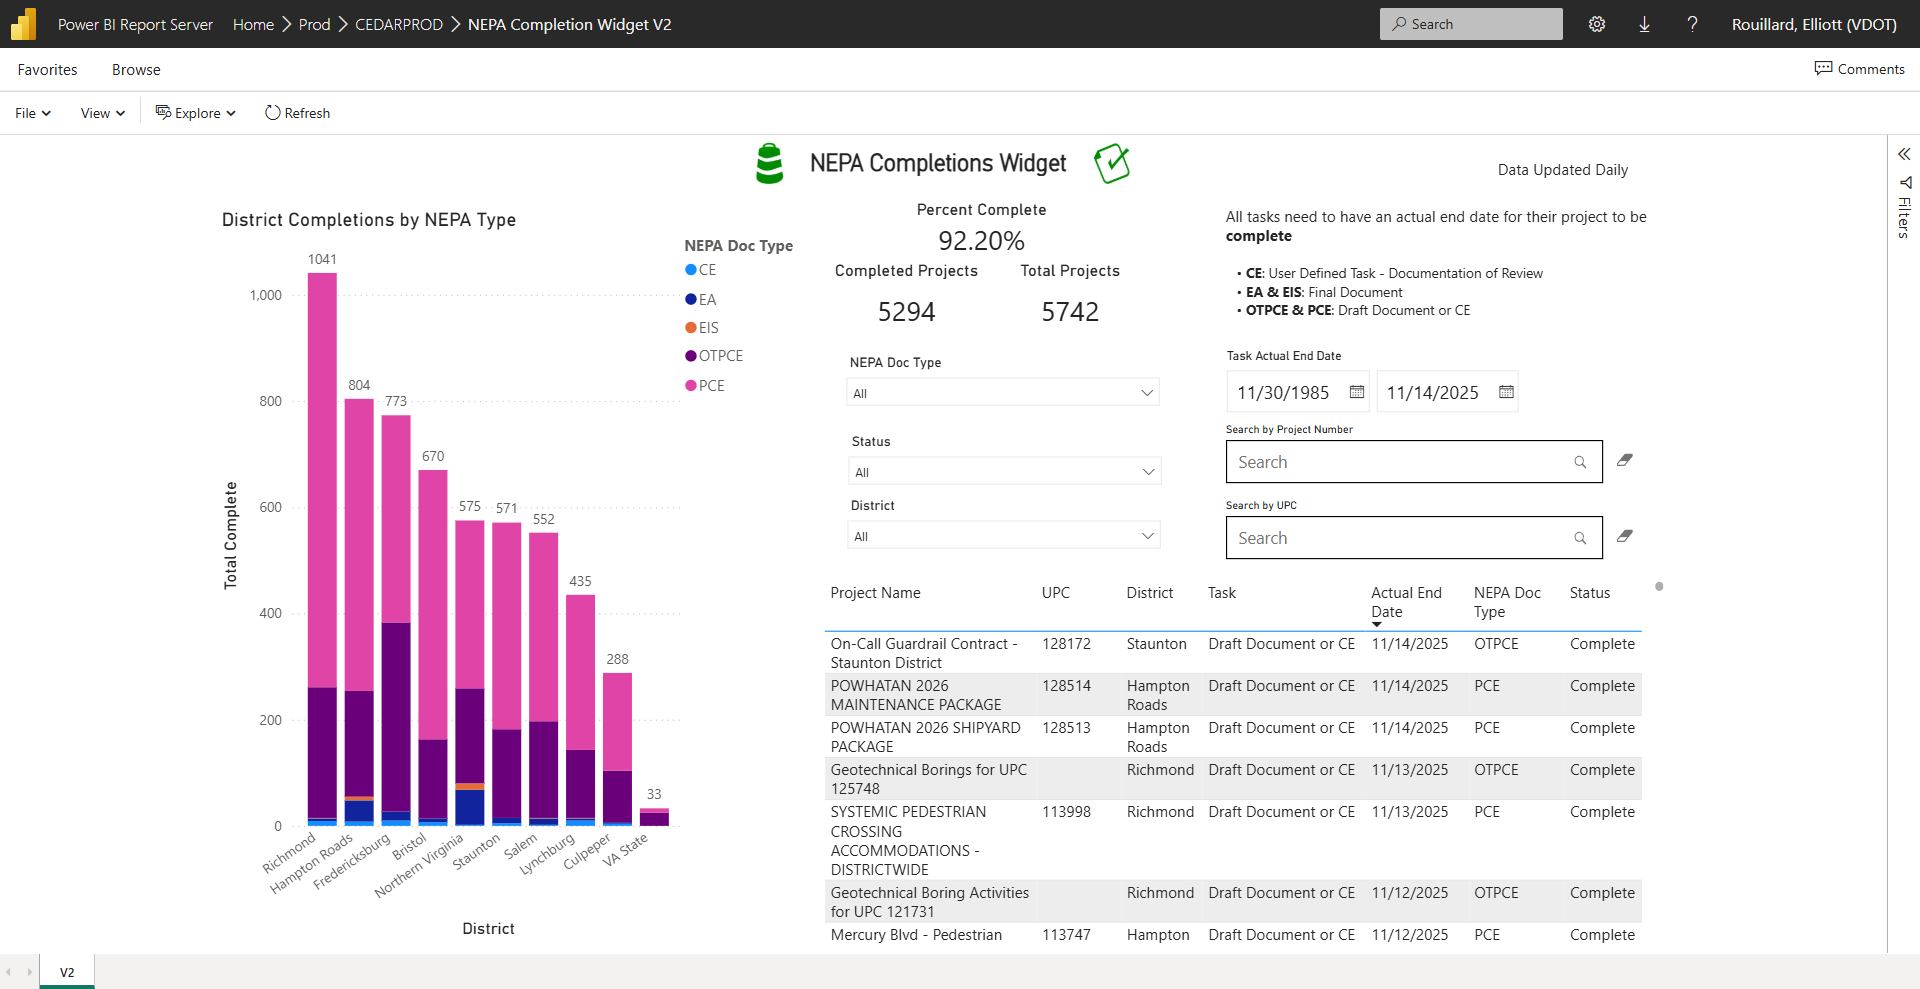
The NEPA Completions Widget allows environmental planners to quickly see which transportation projects across Virginia are using best practices to complete the environmental review/national environmental policy act processes. I wrote a custom DAX query that follows business rules to determine the completions status. It is dynamically applied to evaluate each project that qualifies.
*updated daily using report server
Ex 2) Hurricane Helene Permit Tracking

Following the devestating floods of Hurricane Helene, I was tasked with creating an easy-to-use dashboard that displayed all repair projects and their applicable US Army Corps of Engineers permits. This allowed project managers and environmental staff to quickly see the status of hundreds of projects and reduce complexity in determining further action.
A dynamically generated link to the system of record allows for easy documentation and inspection of further detail. Completed in a 2 day turnaround time.
*updated daily using report server
Ex 3) Hexavalent Chromium Awareness Report

This report displays VDOT steel welder’s status of enrollment in hexavalent chromium safety programs (identifying info hidden!).
It combines four different datasets from two seperate enterprise systems into one report. I had to build it in such a way that exposure to hexavalent chromium was calculated according to OSHA regulations. It is updated weekly using an elegant power automate flow that extracts data from zipped excel reports.
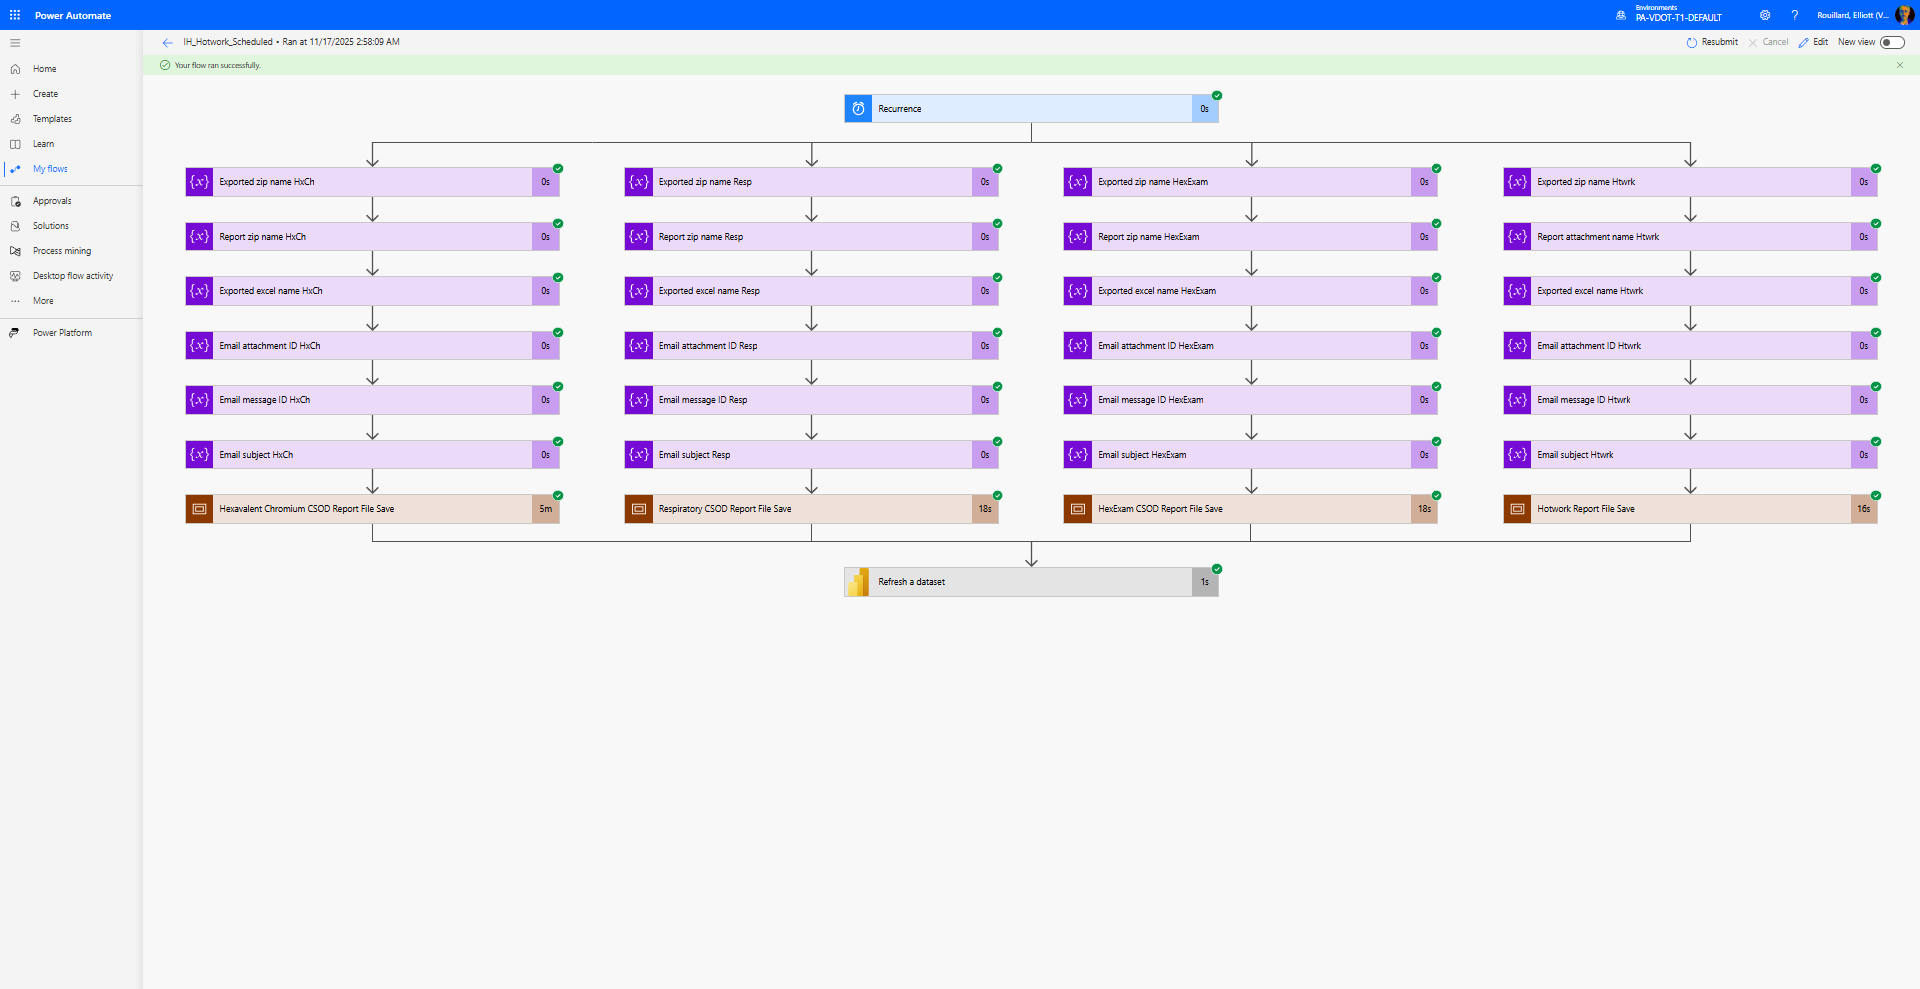
*updated weekly using power automate
Ex 4) CEDAR Roles and Permissions Helper
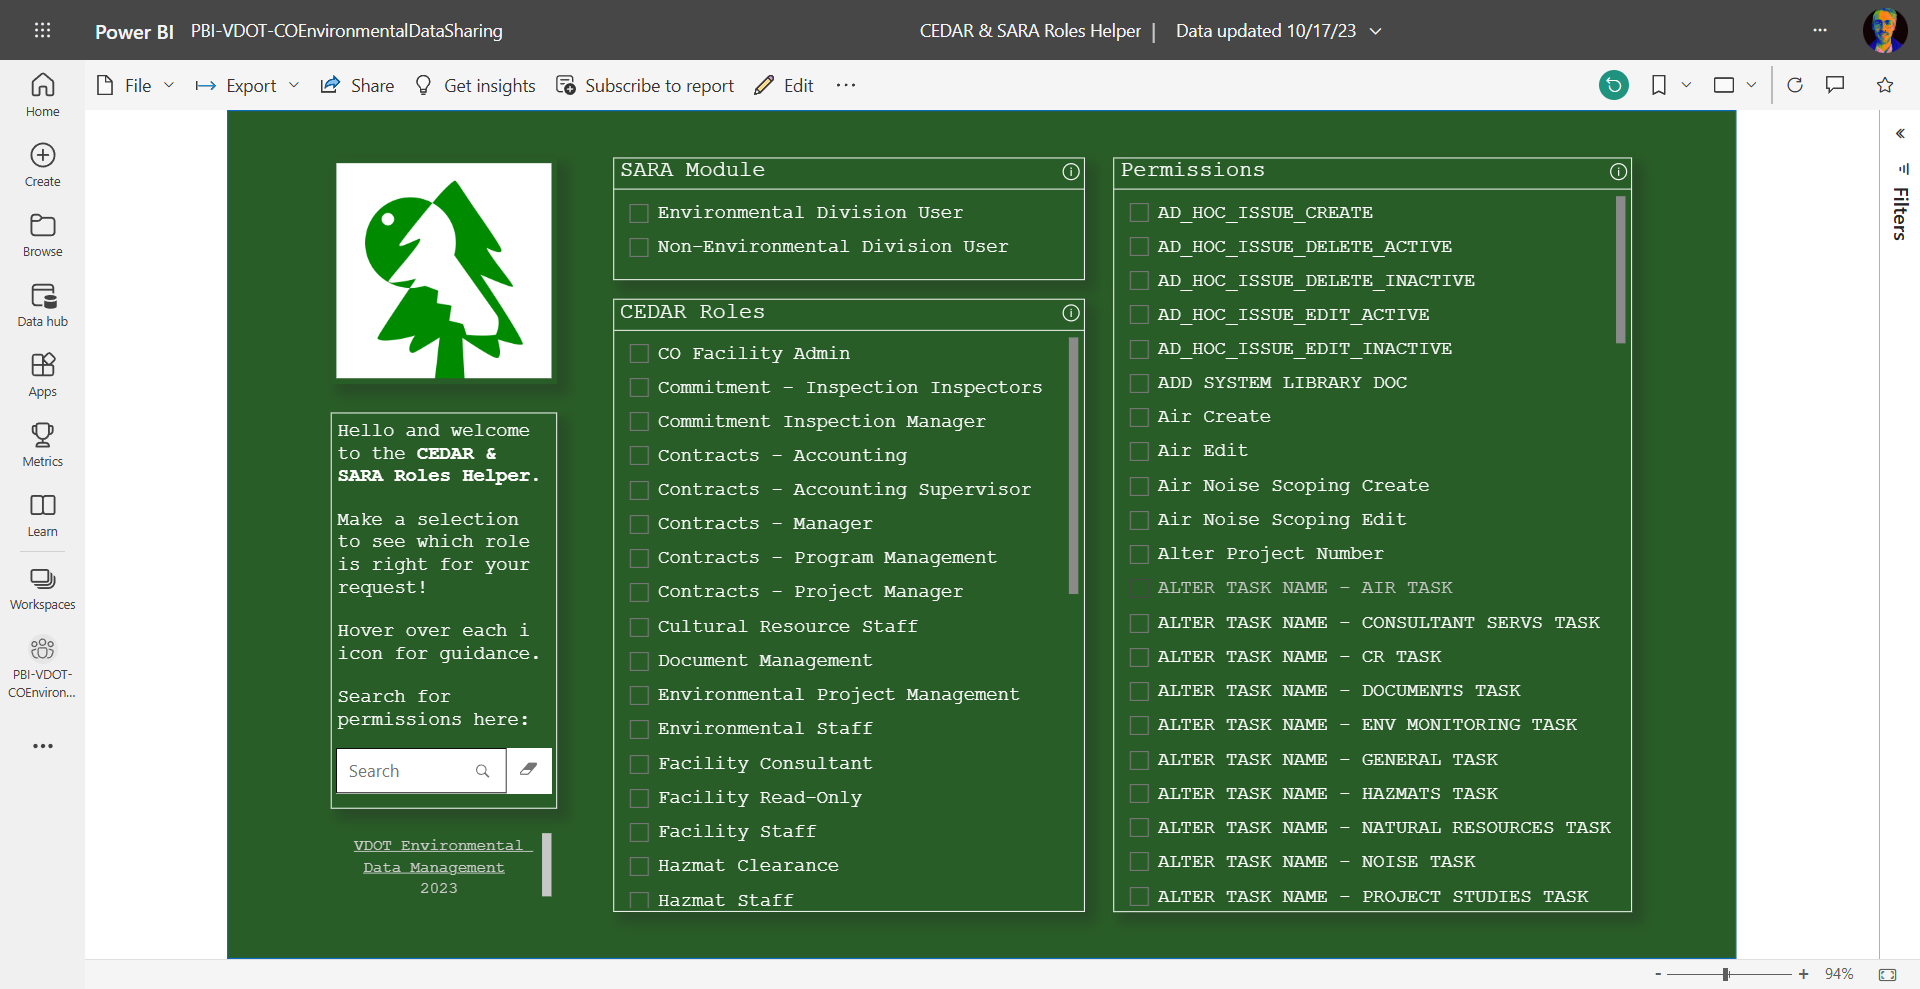
I made this dashboard to ease the administrative burden of determining what roles users should be assigned in the comprehensive environmental data and reporting system (CEDAR). It allows managers to select a role and see all the different parts of the system and workflows to which their staff can gain access.
*static data created using SQL query
UFO Sightings Web App
Check out the UFO Sightings App I built here
It was lovingly crafted using data pulled from NUFORC and made available from data.world in 2016. I joined the UFO data with state boundaries from the USCB and did a little normalizing against the 2020 Census population data to allow us to see which states are the “hot spots” of UFO sightings.
I also clustered individual sightings so that the actual locations could be seen from multiple view levels.
All of this is tossed into an ESRI experience builder app shell and made readily available in a matter of hours!
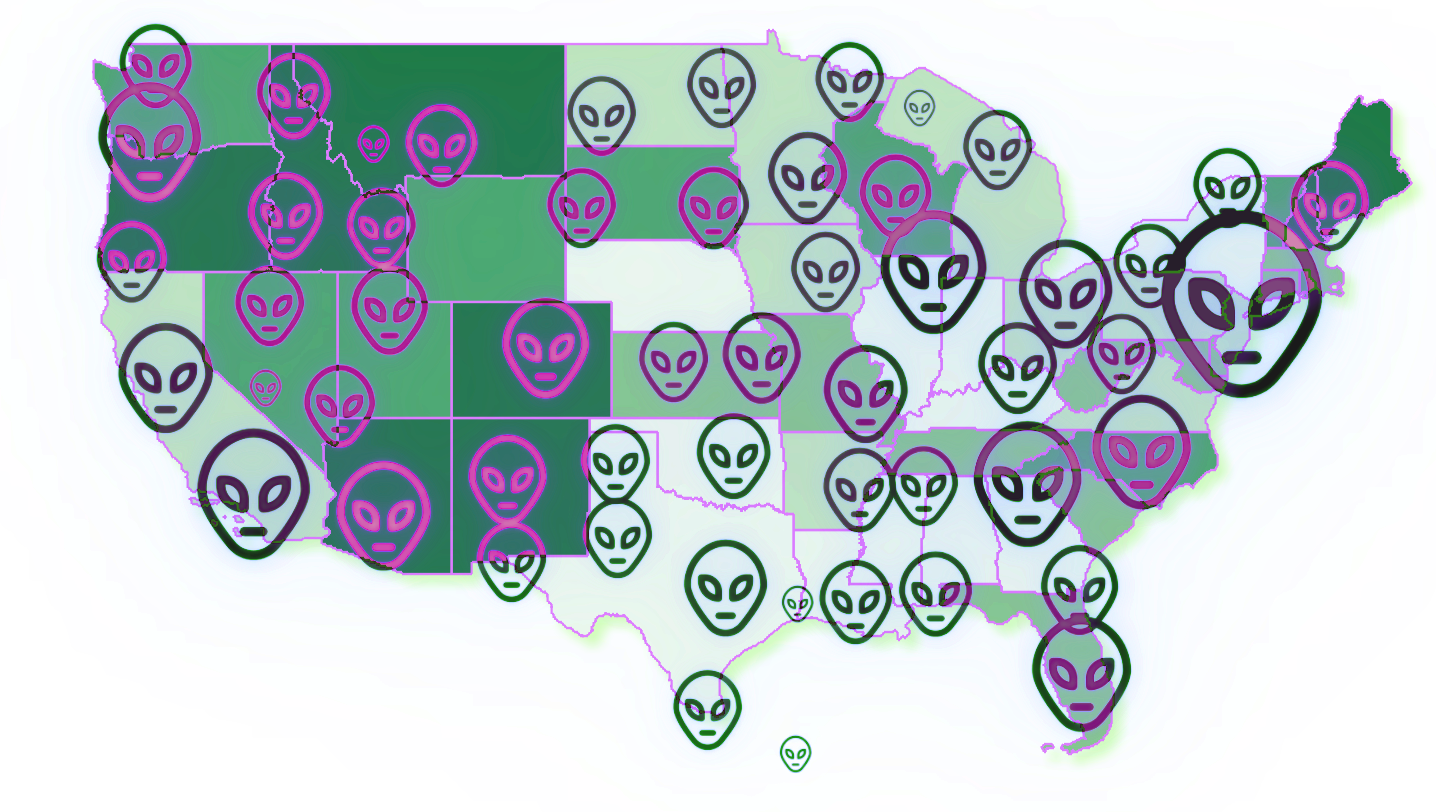
(FYI it’s intended to appear like an old geocities site ︎)
*ESRI ArcGIS Pro, US Census Data, ArcGIS Online, ESRI Experience Builder, and Adobe Express for Icons and Text